Visualizations
Visualization is the representation of your raw data in graphical form.
By default, Holistics displays your report data in a table. While this gives you a full view of your query result, sometimes interesting patterns only show themselves when you give them shapes and colors.

Please visit the following pages to find out more about our supported visualizations.
- Table
- Pivot Table
- Metric/KPI
- Line Chart
- Area Chart
- Column Chart
- Bar Chart
- Combination Chart
- Pie Chart & Donut Chart
- Scatter Chart
- Bubble Chart
- Retention Heatmap
- Geo Heatmap
- Conversion Funnel
- Radar Chart
- Word Cloud
- Gauge Chart
Visualization Settings
Visualization select panel

This is where you choose your visualization (chart) type. Each type has unique requirements for the underlying data, as well as unique settings and styling options.
Please visit the individual docs of each visualization type for more details on their settings.
Settings tab
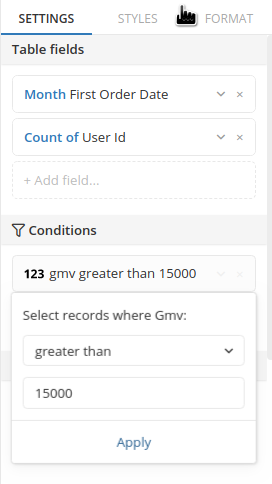
Settings tab is where you select the basic settings to build up your visualization:
- Fields: The fields required will vary between different char types. For example, in Bar Chart, X and Y-Axis are compulsory while Legend is optional, but in Pie Chart you need to choose Legend and Y-Axis is compulsory).
- Conditions: This is where you apply filter condition on the result set. Available operators will depend on the data type of the column. For example,
greater thanandequal toare available for numeric columns, whilecontainsandinare available for text columns. - Sorts: This option allows you sort your displayed data in along a field that you already dragged in.

Styles tab

This is where you control the graphical styling of your charts. The options will vary between different chart types.
Format tab

This is where you choose display format for your data. This tab is the same for all chart types. The visualization editor will default to variable character (varchar) type if it is unable to detect your column's data type.
Troubleshooting
Error: Too many columns, not showing all data
This error happens when you add a field (which contains more than 100 values) to the Column Field (of Pivot Table) or to Legend Field (of other charts) in the Viz Setting.

Currently, we only support showing a maximum of 100 columns. If the field has more than 100 values, Holistics will visualize a preview of the first 100 columns. It is recommended that you use a column with low cardinality in the Column field or Legend field to reduce visual clutter, which will improve the readability of your chart.