Report Editor Step-by-step Guide
Our Report Editor allows you to point-and-click your way to building the charts and pivot tables you need straight from your SQL database with a simple query.
Select Analyze from the top bar in Holistics to bring up the Report Editor, and find the table you need. Click on the Analyze button next to the table, which will bring up your data. You can then point-and-click to build charts and pivot table visualizations, using the columns from your table.
You can watch this video for a quick idea of how it works, or browse through the steps below.
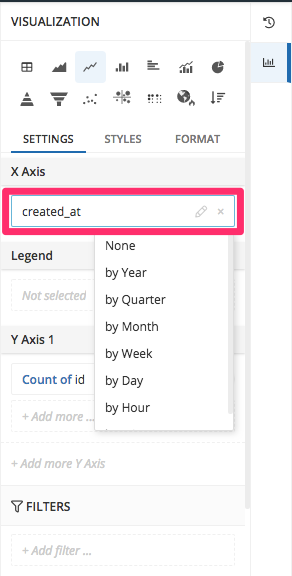
Select visualization settings, or pull up the visualization type from the chart dropdown menu:

Under the **Settings** tab, you can then choose the columns and formulas/aggregations you want to apply, to build your visualizations.
More information on building charts with our Report Editor can be found here.