Quick Pivot (Legacy)
Like the name suggests, Quick Pivot allows you to quickly perform "pivot-table" transform on a report's result dataset.
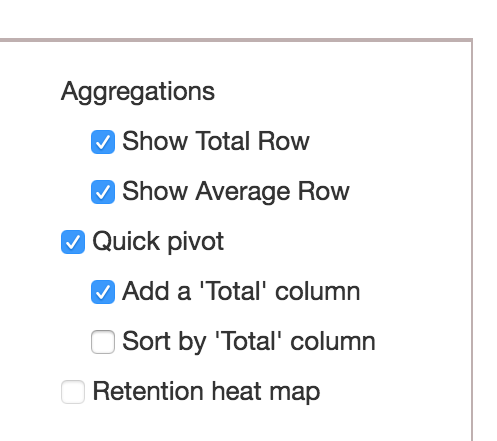
After running your query, you can pivot the table by selecting the 'quick pivot' option in the report editing page under the SQL Editor panel.

How It Works
Given the following table that stores your pageviews traffic data:
CREATE TABLE traffic_pageviews (
  date_d DATE,
  traffic_source VARCHAR,
  country VARCHAR,
  pageviews INT
)
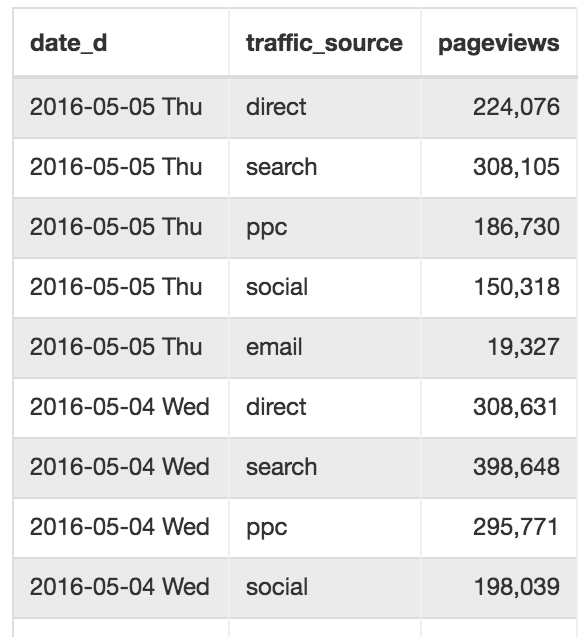
A simple select to get your pageviews by traffic:
SELECT
  date_d AS "Date",
  traffic_source AS "Traffic Source"
  SUM(pageviews) AS "Pageviews"
FROM traffic_pageviews
GROUP BY 1, 2
ORDER BY 1 DESC, 2
will get you something like this:
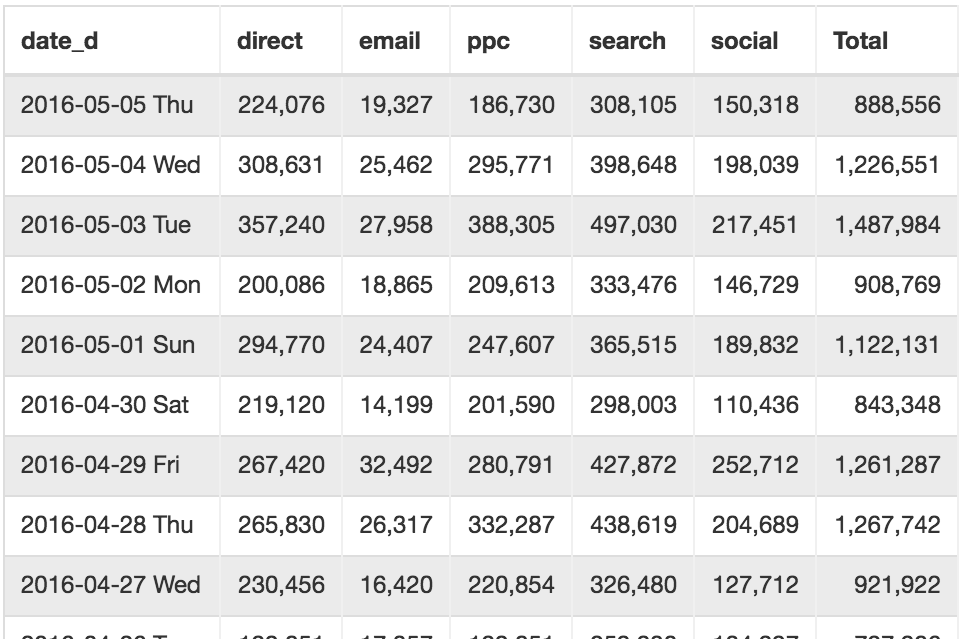
'Quick Pivot' allows you to instantly generate this, which is a lot easier to consume (and visualize).
Usage
A few notes on how it works:
- It uses the last column as the measure values (numbers)
- It uses the second last column as the dimension to be pivoted
- You can have as many remaining columns on the left as you want.
To use, you'll find an option for 'quick pivot' in the report editing page, under Preview panel.
Can I still achieve the same thing without 'Quick Pivot'?
Yes but. You'll have to write more troublesome SQL queries like this:
SELECT
  date_d AS "Date",
  SUM(CASE WHEN traffic_source = 'direct' THEN pageviews ELSE 0 END) AS direct,
  SUM(CASE WHEN traffic_source = 'search' THEN pageviews ELSE 0 END) AS search,
  SUM(CASE WHEN traffic_source = 'ppc' THEN pageviews ELSE 0 END) AS ppc,
  SUM(CASE WHEN traffic_source = 'social' THEN pageviews ELSE 0 END) AS social,
  SUM(CASE WHEN traffic_source = 'email' THEN pageviews ELSE 0 END) AS email,
  SUM(pageviews) AS total
FROM traffic_pageviews
GROUP BY 1
ORDER BY 1 DESC, 2
And even so, when new traffic source comes, you'll have to modify the report's query to cater for new cases.
What's the difference between Quick Pivot (Transform) and Pivot Visualization?
Quick Pivot allows you to pre-transform the queried data, and after that you can apply a graph (Line Chart, Column Chart, etc) to it.
Pivot Visualization is a visualization itself based on the data queried.